LAUNCH EXCELLENCE (LEx)
Internal Application for Bayer
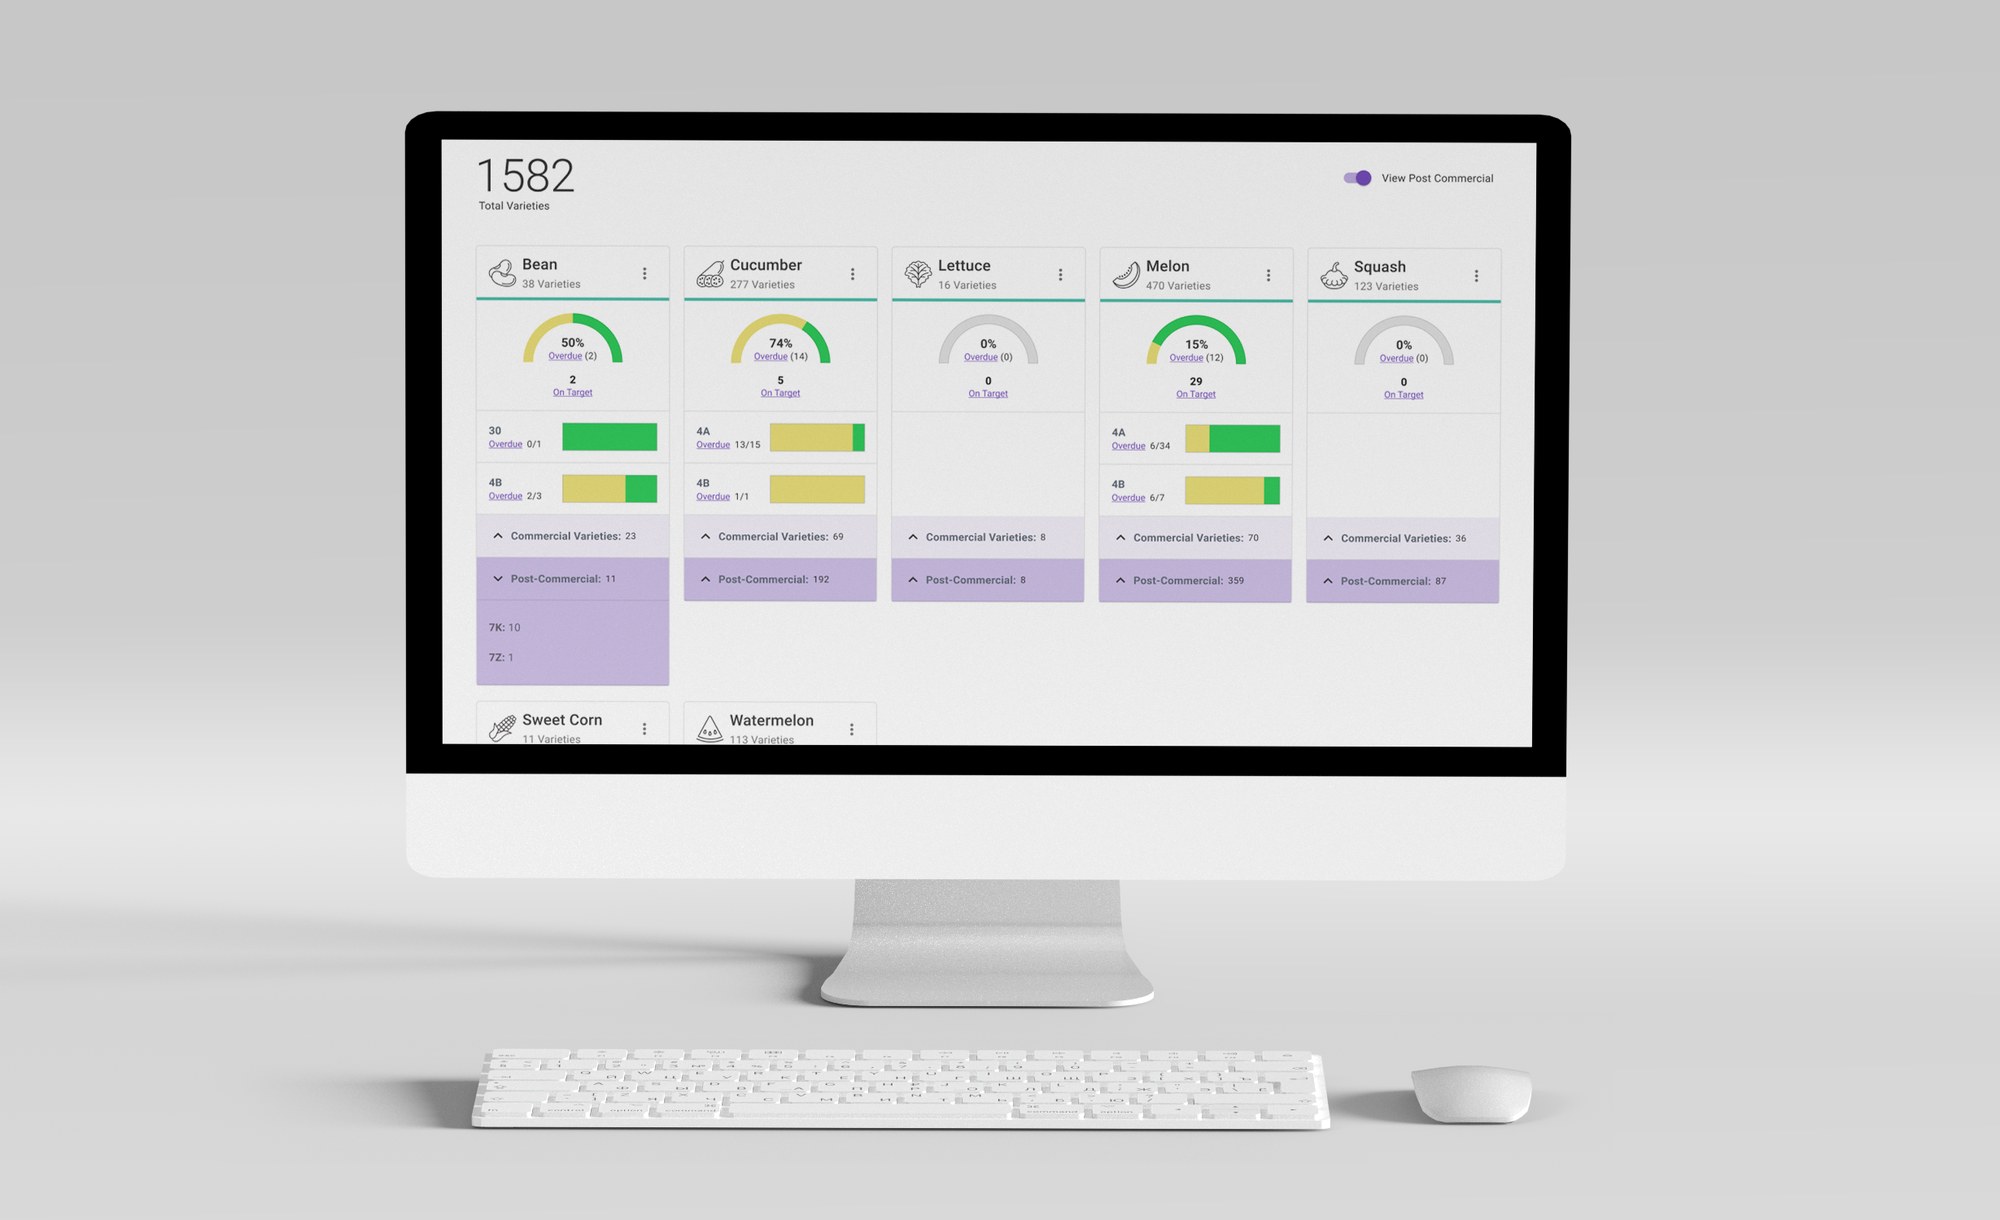
TLDR
Goal: the project aims to address challenges in launching new varieties, missing deadlines costing the business significant financial loss
My Role: continuous discovery, workflow design, wire-framing, prototypes, and user testing
Identified pain points: standardization, visibility, lack of process
Proposed solutions: build the application to create and follow plans for products, implement dashboards for visualization, incorporate automation
Project outcomes: positive feedback from business and validation sessions; artifacts and documents describing problems, solutions, and iterative processes; working directly with devs to build out the application for users; millions of dollars in saved revenue for Bayer as a result of application development
Problem Statement
The establishment of a well-defined, end-to-end, consistent framework for launching new varieties is crucial. Presently, the absence of transparency impedes the speed to market and restricts the return on investment. Consequently, prioritizing the integration of transparency throughout the entire process becomes imperative to overcome these challenges.
Overview
The objective of this project is to standardize and streamline the launch process, ensuring efficient and effective product launches. This involves promoting alignment among all Launch Team members to foster collaboration and enhance communication. Additionally, within the product plan, it is essential to identify significant milestones and expose relevant data through a dashboard, allowing for easy access and visibility. By implementing a "Plan feeding the data" approach, the project aims to track progress and ensure timely execution. Furthermore, the project seeks to create an actionable dashboard that can identify problem areas throughout the launch process, enabling prompt resolution. Collecting data on key metrics will facilitate continuous improvement efforts. To address business needs, the project will focus on making the dashboard user-friendly and easy to operate, ensuring a seamless experience for all users. Additionally, opportunities for automation will be explored to streamline processes and increase efficiency.
Users
Seed Breeder, Global Segment Leads, Market Devs, Marketing, Operations, and individuals responsible for guiding products from ideation to market at Bayer
Team
Developers, Project Manager, UX Designer, Researcher, Strategist, Agile Coach
My Involvement
- Led and managed a high-performing UX team to develop an application for tracking crop product progress.
- Created an intuitive user interface and user-centric design approach, resulting in significant cost savings and increased revenue for the organization.
- Oversaw the end-to-end UX design process, including user research, information architecture, wireframing, prototyping, and user testing.
- Collaborated closely with stakeholders, developers, and product managers to align design strategies with business objectives.
Years
2022, 2023
The Initial Experiment
Experiment Objective
Accelerate our understanding of the shape of the final solution by creating a UI workflow based on our current knowledge.
Experiment Findings
If we are to streamline and standardize the process, characteristics of a solution emerge:
- Need the ability to capture initial, overall parameters for the launch
- Need flexibility to adapt the plan depending on findings (e.g. change field trial countries)
- Need visibility of overall progress and details
- Need for certain components to be standardized and maintained in a single repository for all plans
Review of Process Workflow
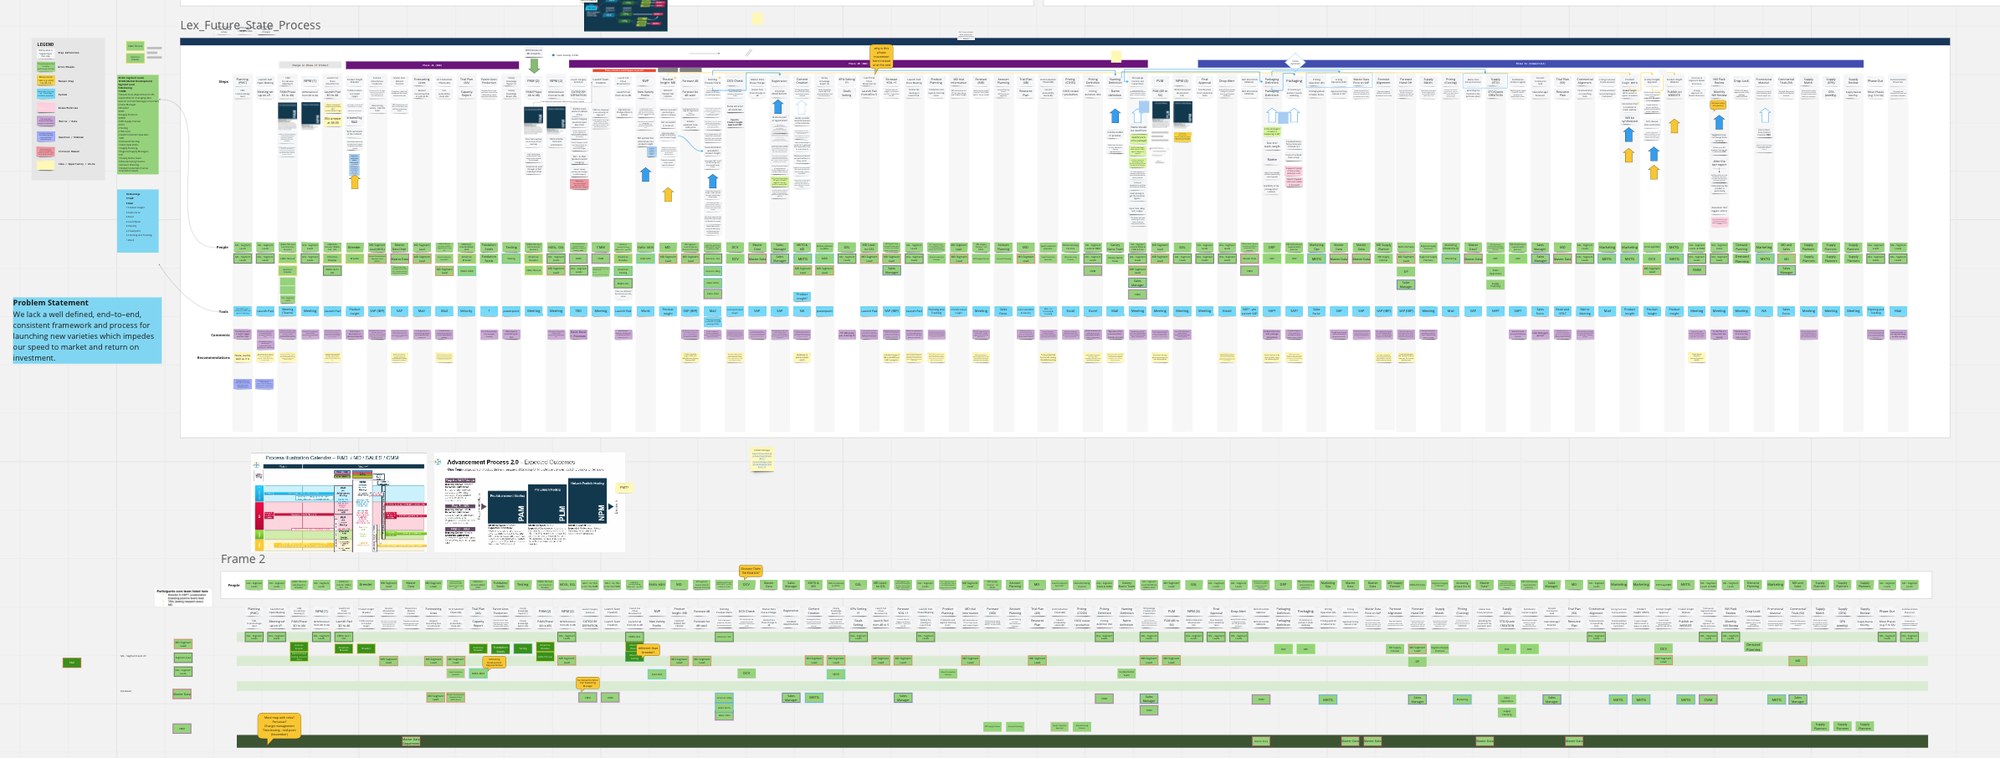
The Discovered Challenge
The Vegetable Business faced a challenge due to the absence of a well-defined and repeatable process, resulting in the failure to meet critical deadlines for operational tasks like Crop Lock, Forecasting, Production Seed, Naming, and more. This issue created a significant setback as the inability to have new products ready by a specific time meant having to wait an entire year before being able to sell them.
Discovered Pain Points from Business Objective
Drive Greater Success in Launching Our New Varieties in a Consistent Manner
- Lack of standardization
- Information regarding producibility needs alignment and automation
- KPIs not standard and can be changed during the Launch – a moving target
- Several tools and databases are used during the process, leading to inconsistency
- Lack of visibility
- Lack of communication with other regions when dropping a material
- Launch plans are not shared in a common and accessible place
- There is no process enabler or tracking tool
- Many areas involved with subprocesses with low visibility
- Role clarity is not in place at some stages
- Lack of process
- Process is complex and long
- Process is focused on pre-commercial phases and not so much post-launch
- Lack of process for setting and tracking of KPIs
- Too much manual work and templates
- Automation is needed but not yet in place
- Limited time for reaction and/or flexibility due to lack of forecasted lead times
Partial Workflow Design
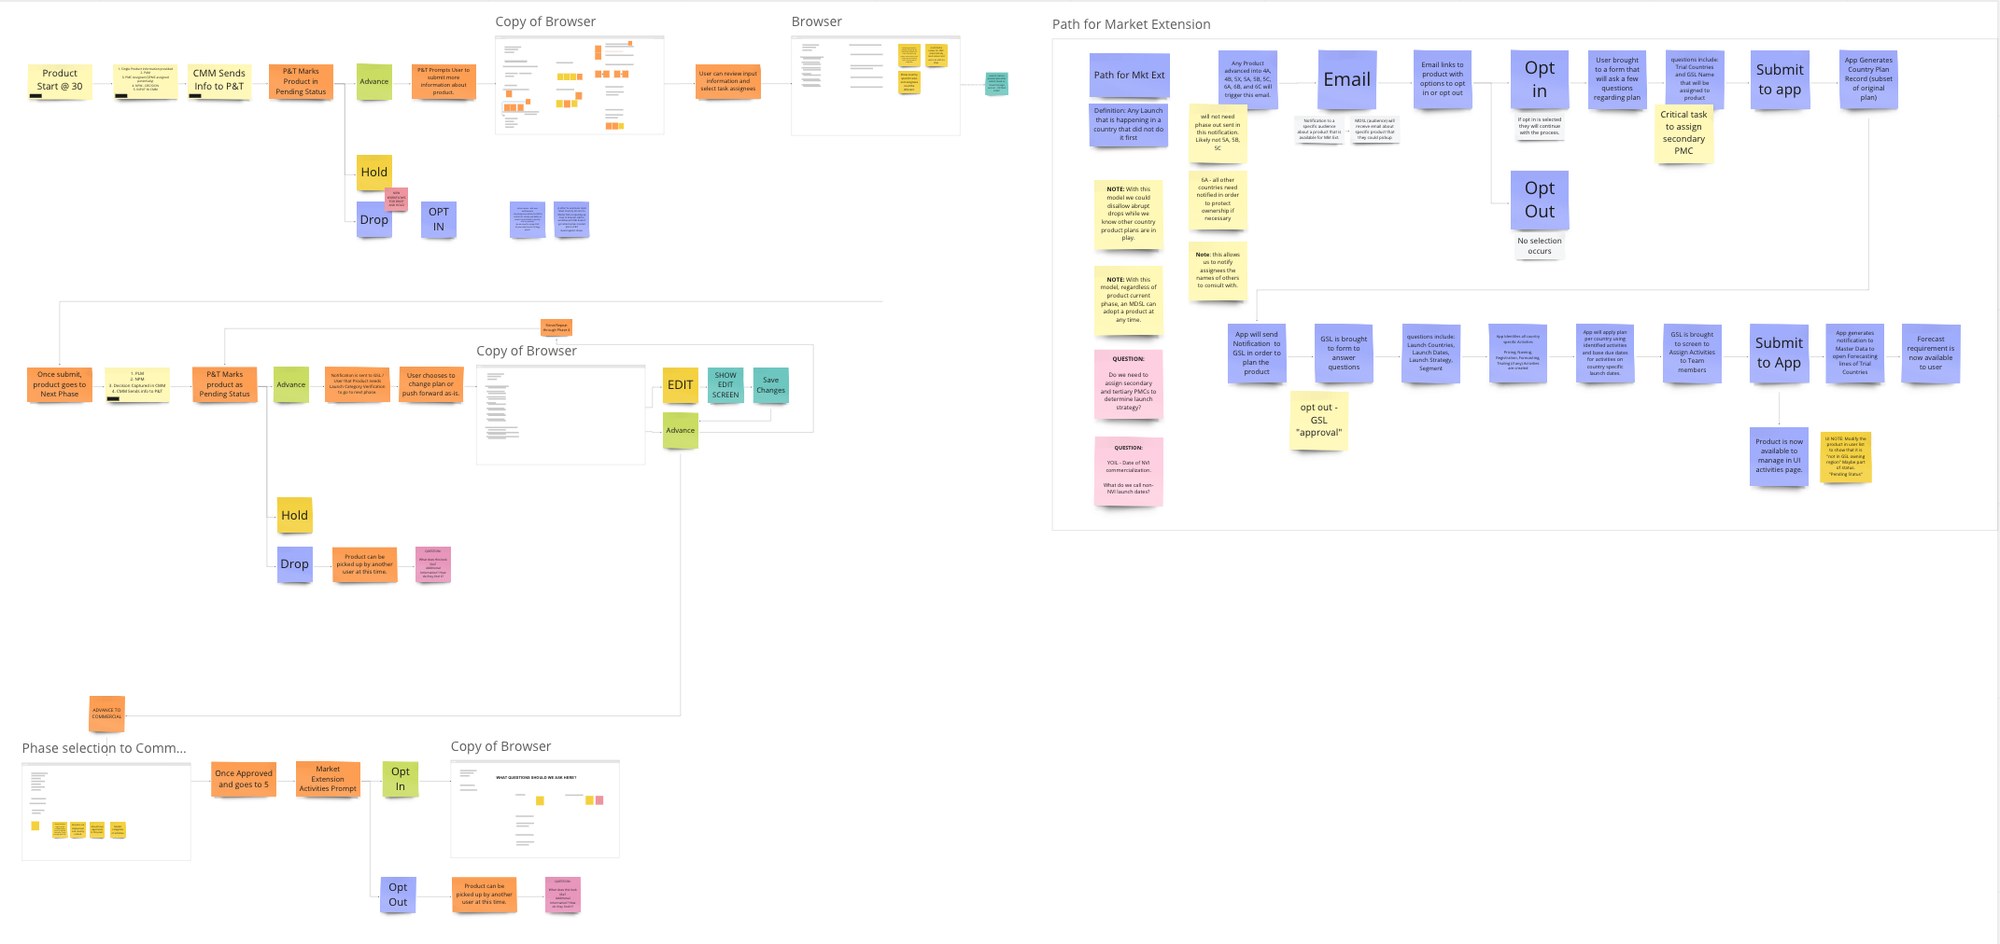
Proposed Solutions for Business Objective
Drive Greater Success in Launching Our New Varieties in a Consistent Manner
- Lack of Standardization — User Pain Point
- Create Commercial Plans — Solution
- Enable Activity Planning in P&T for phase 5 and beyond
- Plans will be launch country-specific, potentially resulting in multiple Activity Plans for each variety
- Each activity plan includes Launch Strategy and other standard tasks/activities
- Look for process improvements throughout activity plan(s), and incorporate when able
- Lack of Visibility — User Pain Point
- Create Dashboards — Solution
- Enable a "Workflow" dashboard to visualize tasks at the assignee's perspective, for clarity of scope, timing, dependencies, and status
- Enable a "Portfolio" dashboard to visualize at portfolio, crop, MCT, PMC, and country/task/activity level
- End to end (phase 30 to Exit) for complete transparency and visibility
- Automation — Solution
- Automated alerts to assignees for start of task/activity lead time
- Automated alerts for dropped varieties
- Automated alerts for at-risk varieties
- Teams channel option for collective task/activity
- Lack of Process — User Pain Point
- Automation — Solution
- Precommercial planning automates creation of country-level plans by utilizing GSBT designations
- Map task/activity dependencies and automate proper lead times
- Use country/role/activity matrix to default to correct activity plan, lead times, and person assignment
- Automated hard stops for both advancements and drops
UI Design
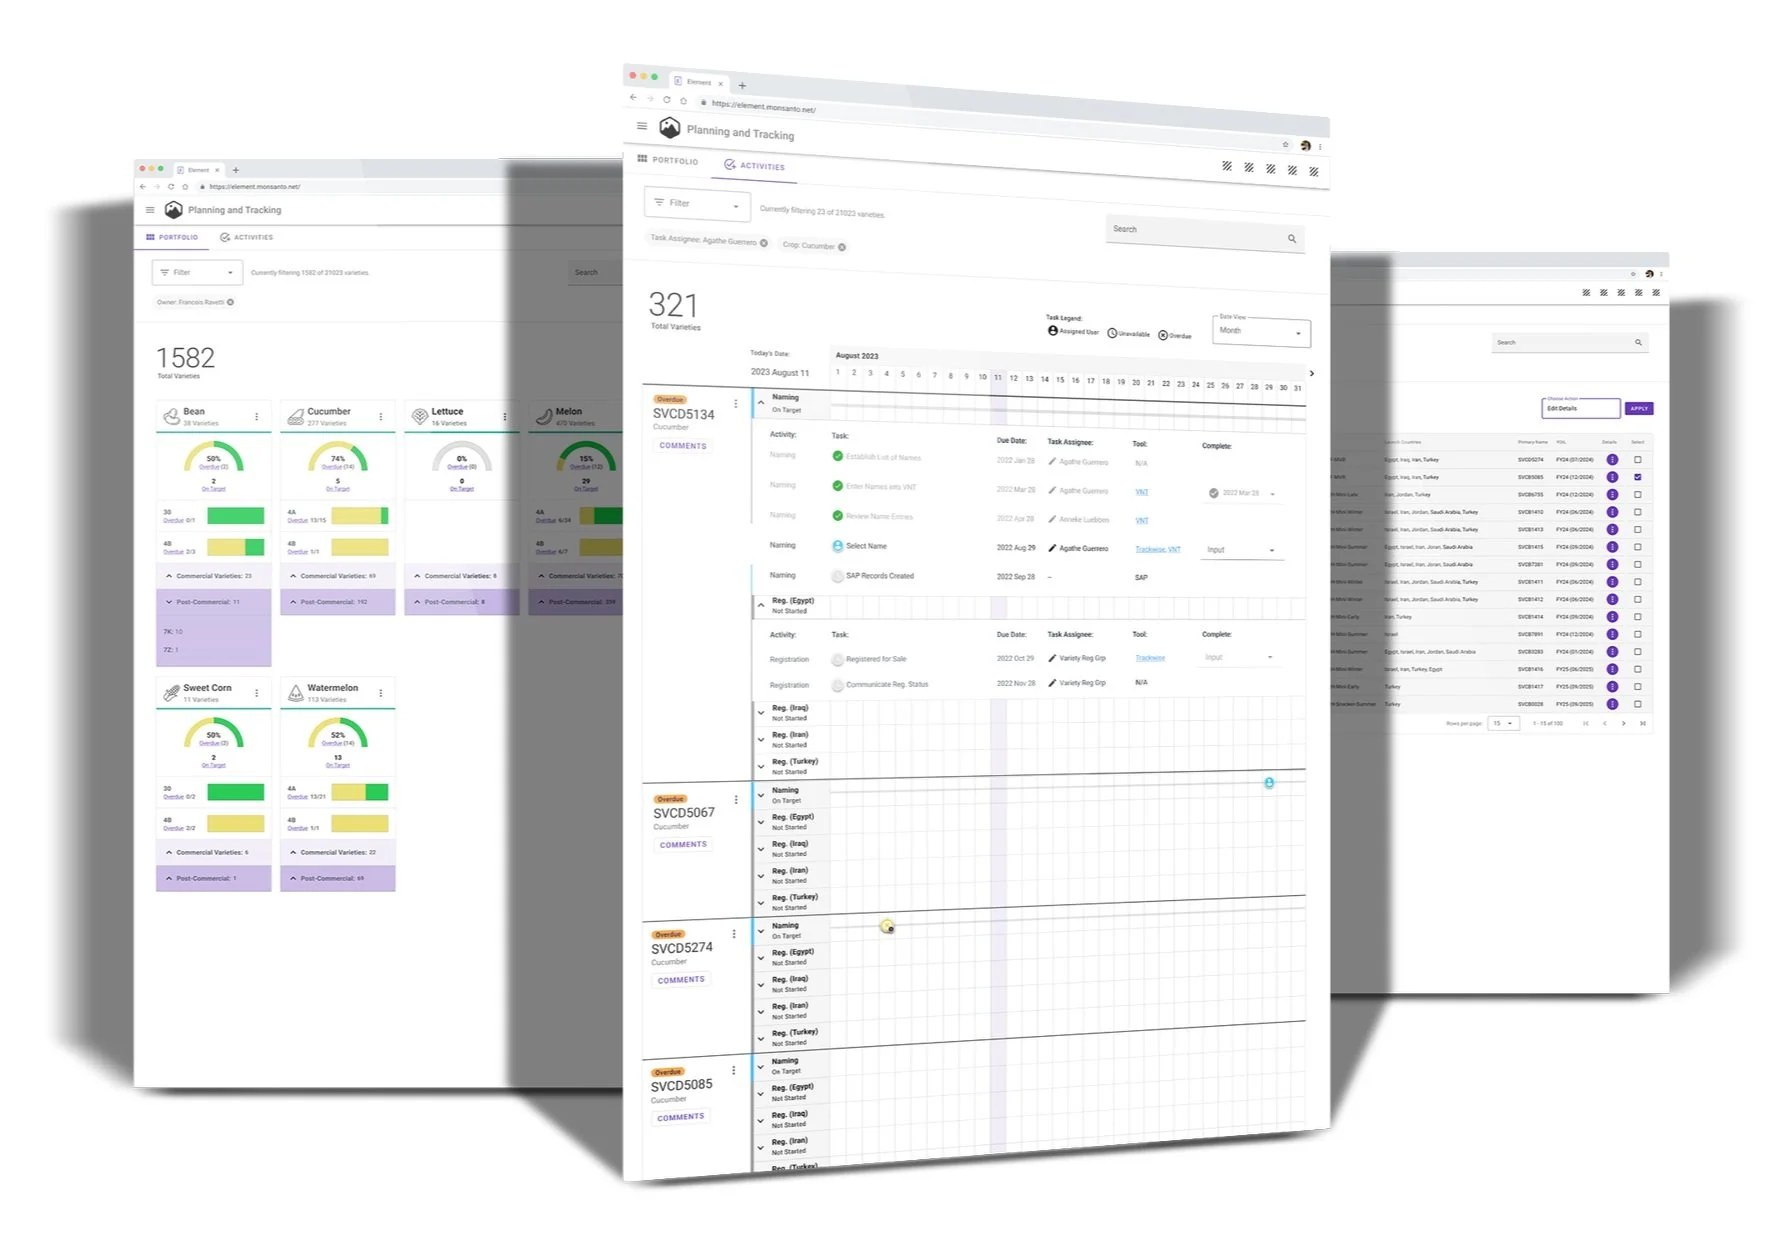
UI Details
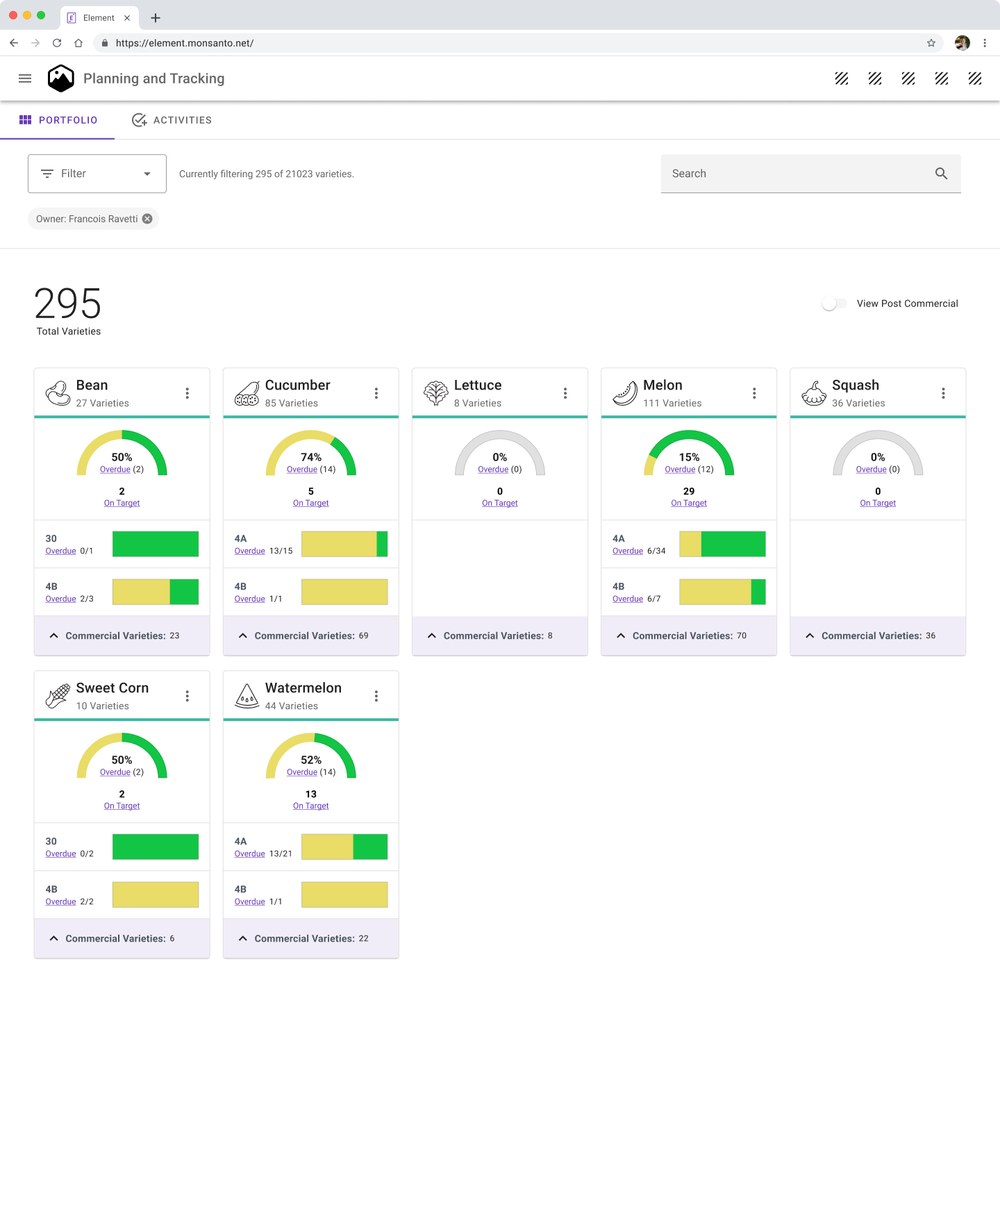 Portfolio - Landing Page 1
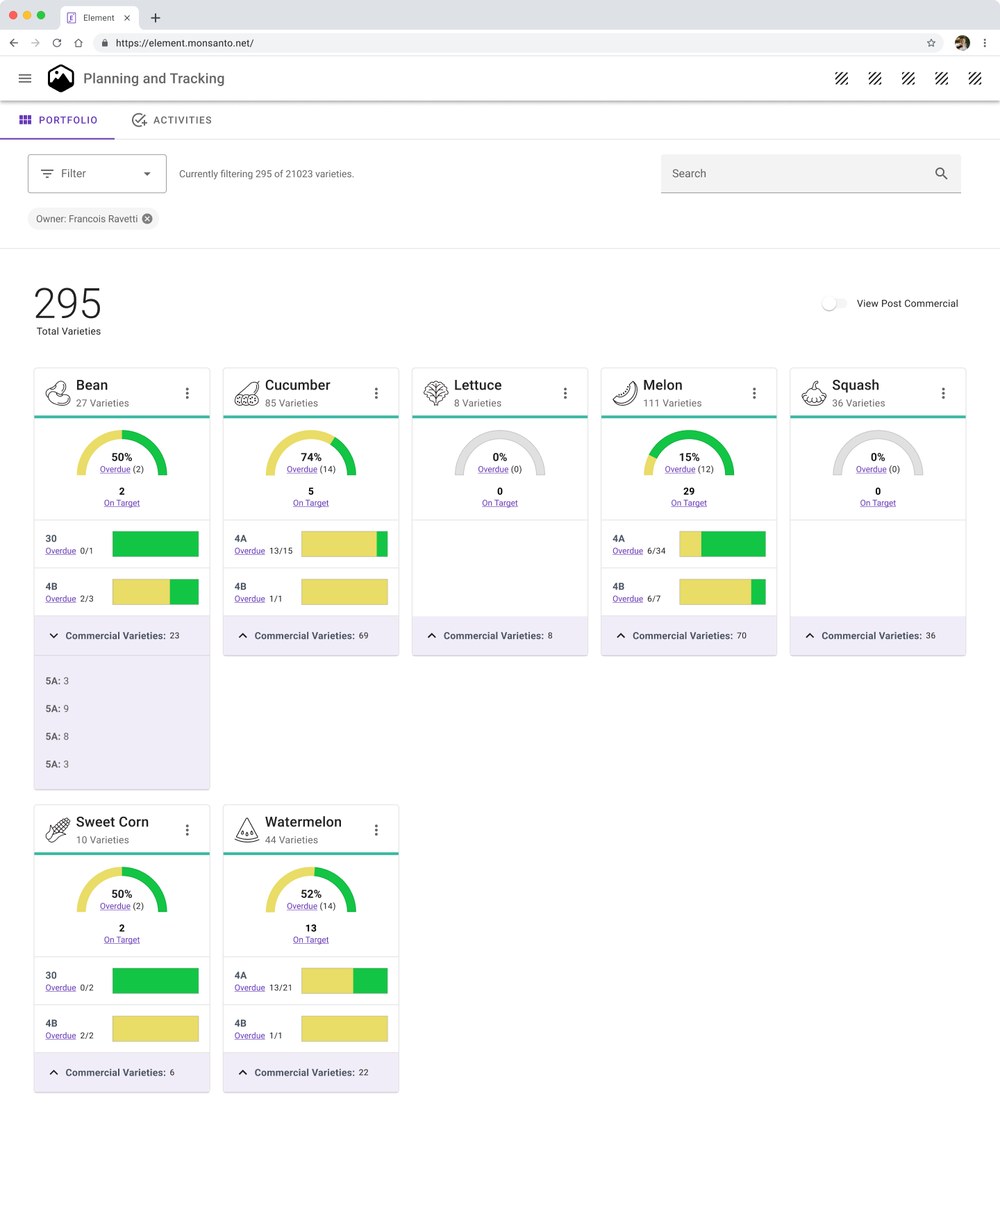 Portfolio - Landing Page Detail 2
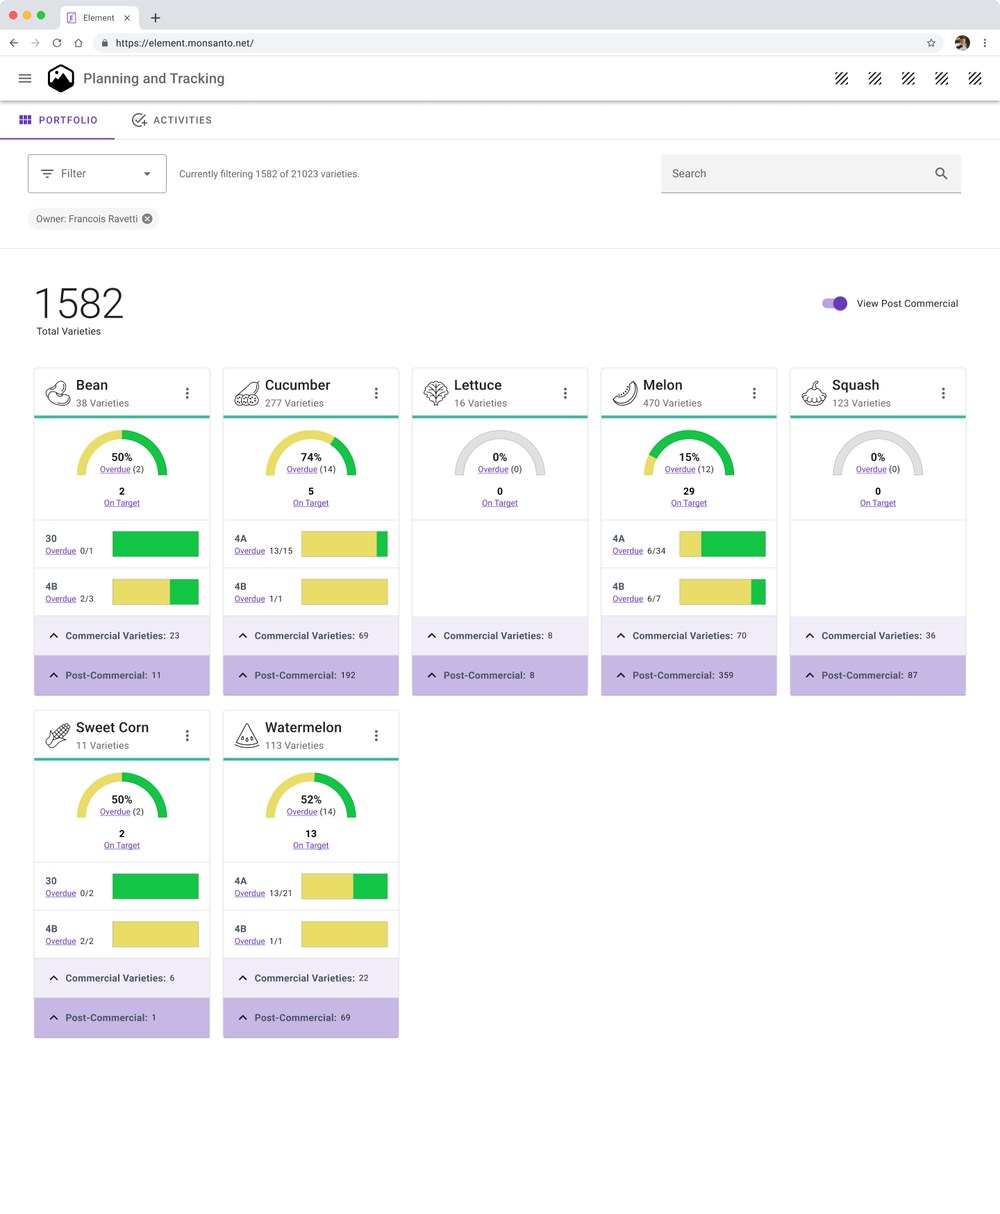 Portfolio - Landing Page Detail 3
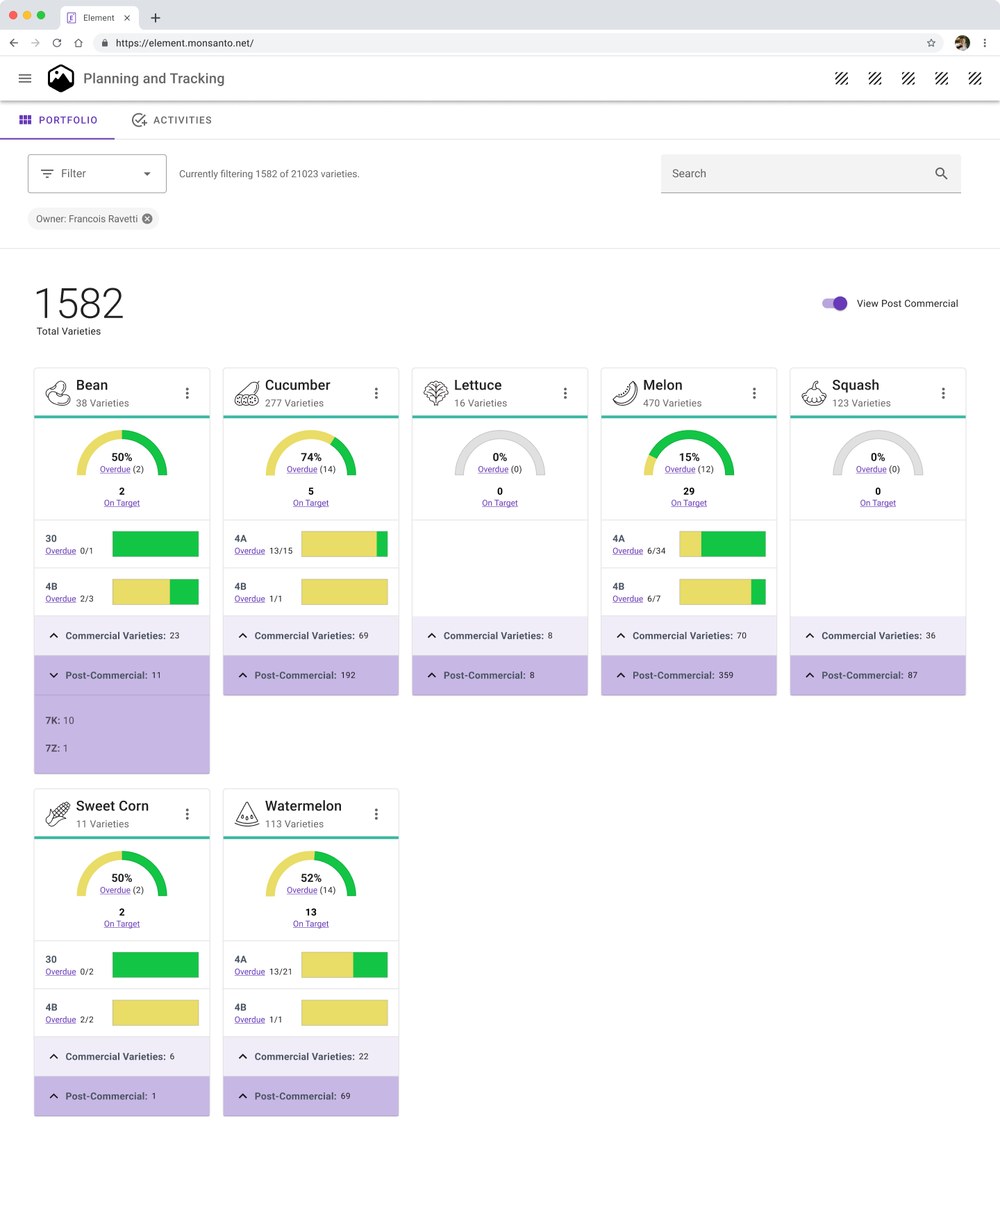 Portfolio - Landing Page Detail 4
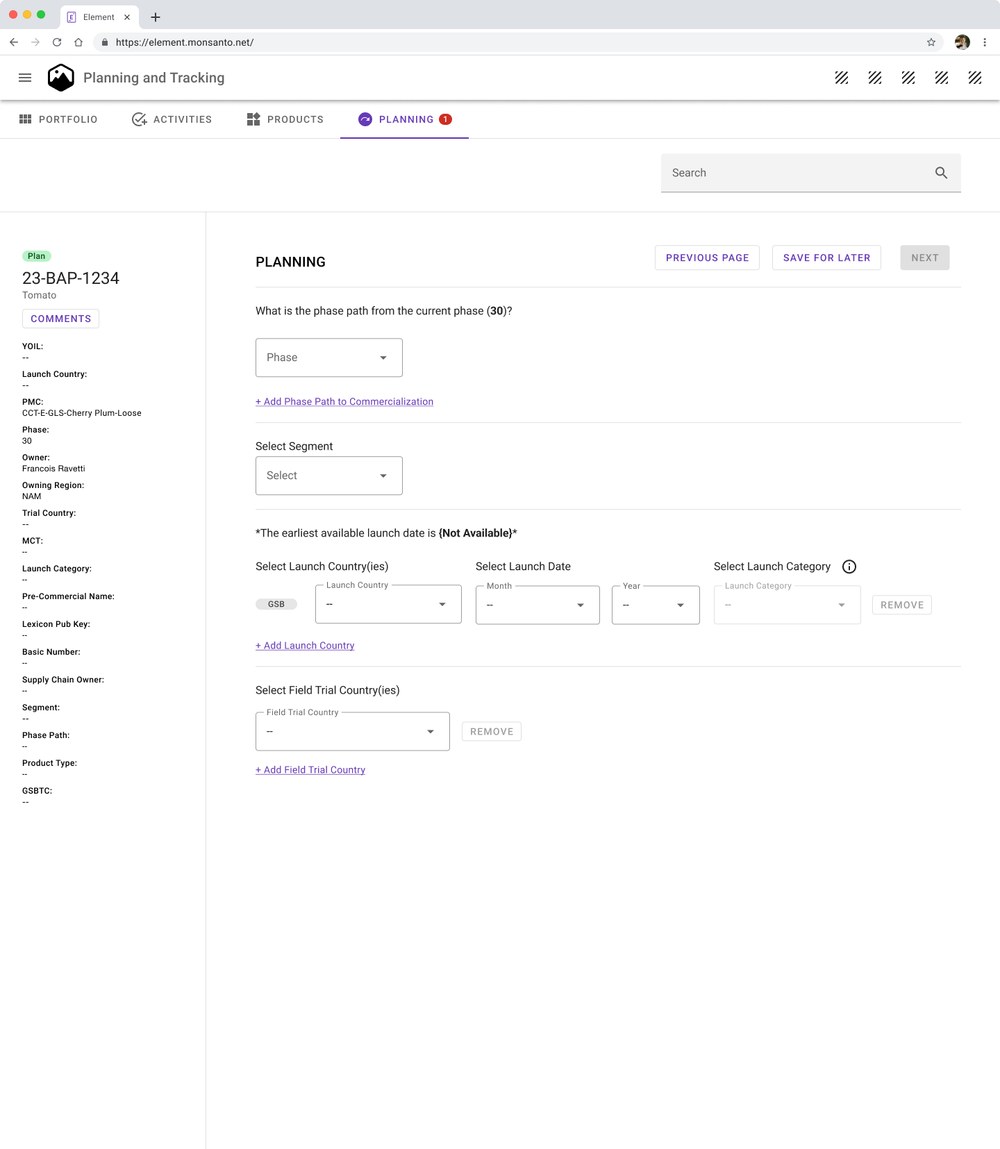 Planning - Assign Details Form 1
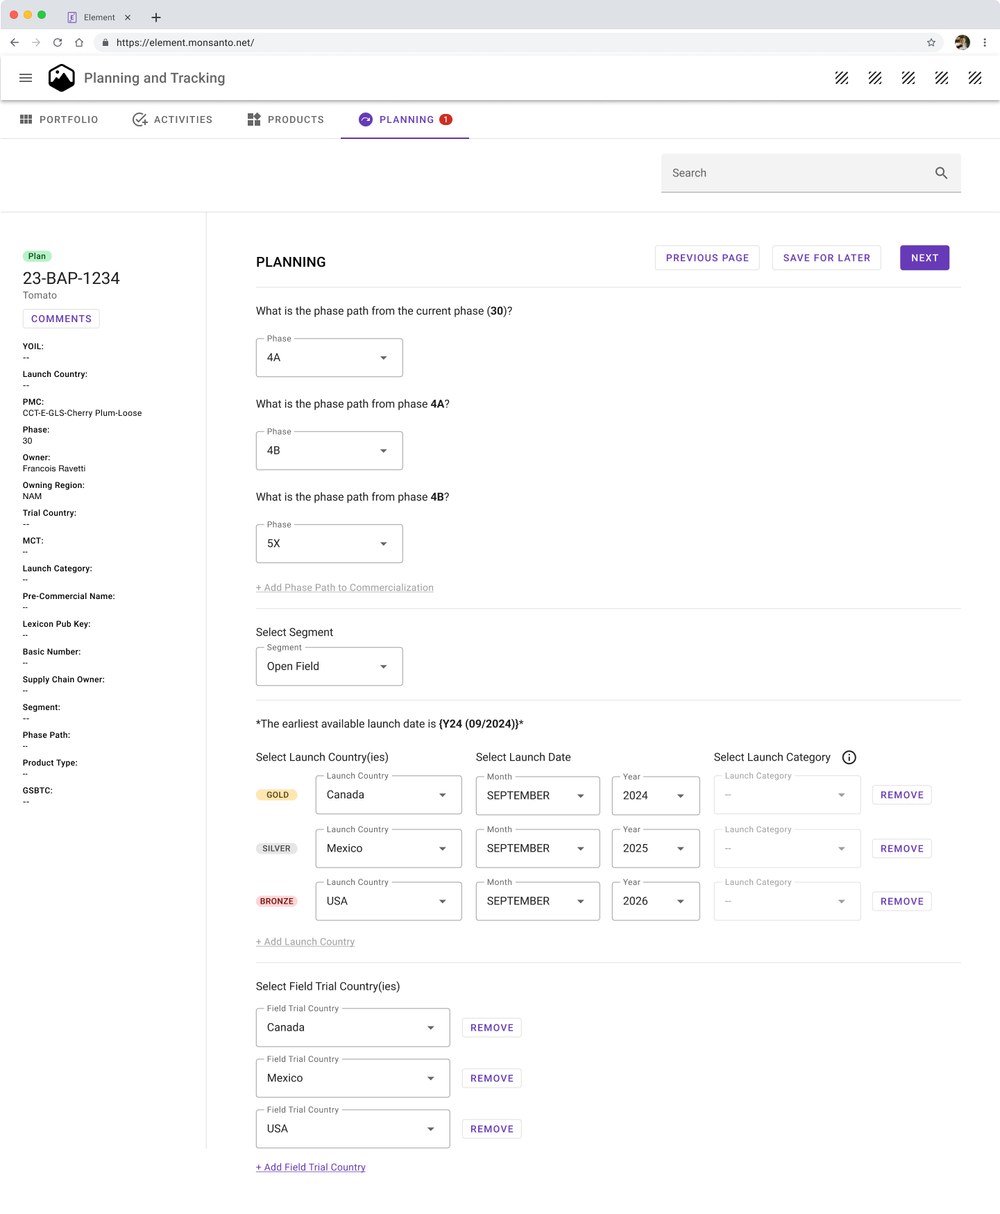 Planning - Assign Details Form 2
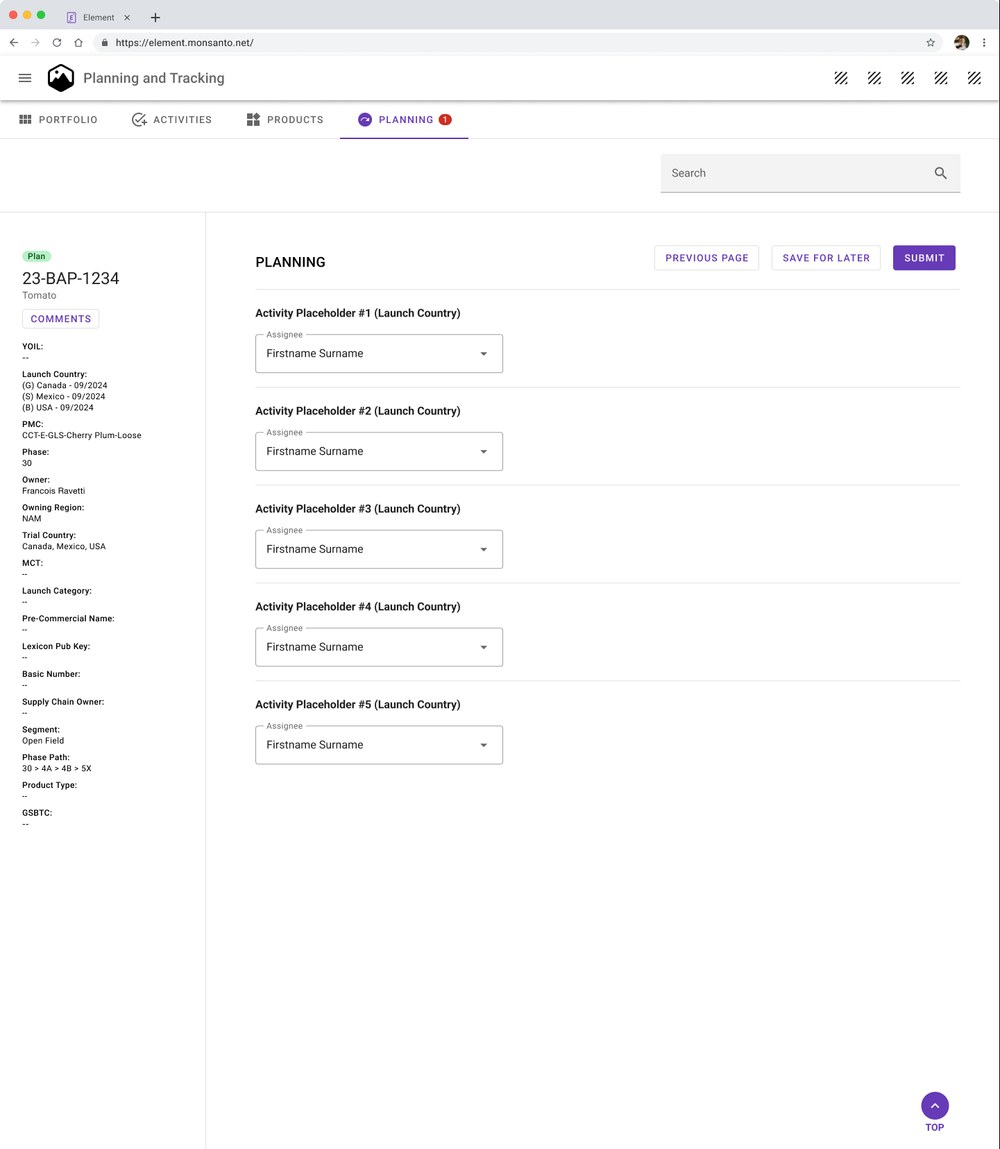 Planning - Assign Tasks to Users
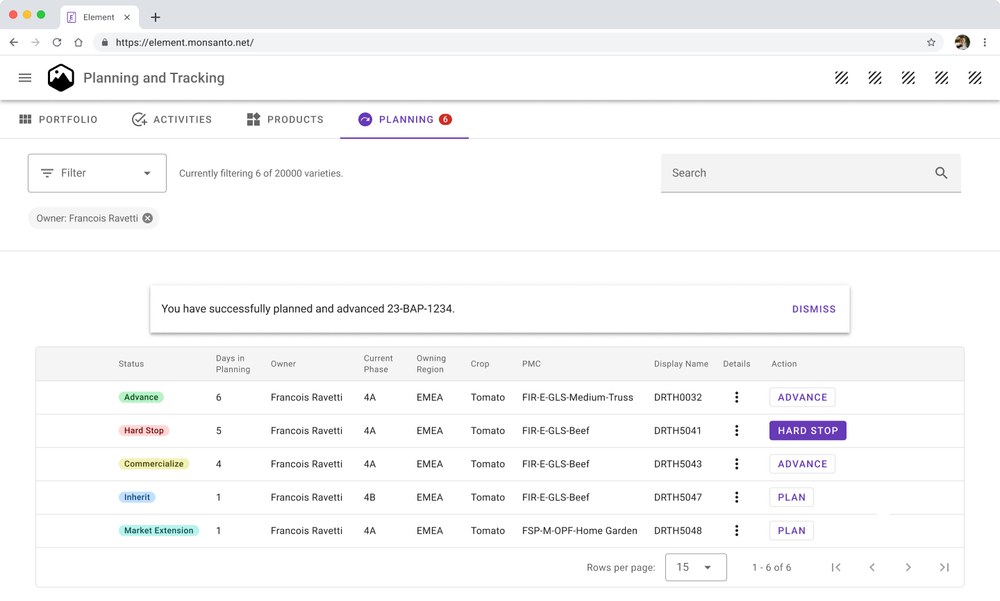 Planning - Product Planned Toast
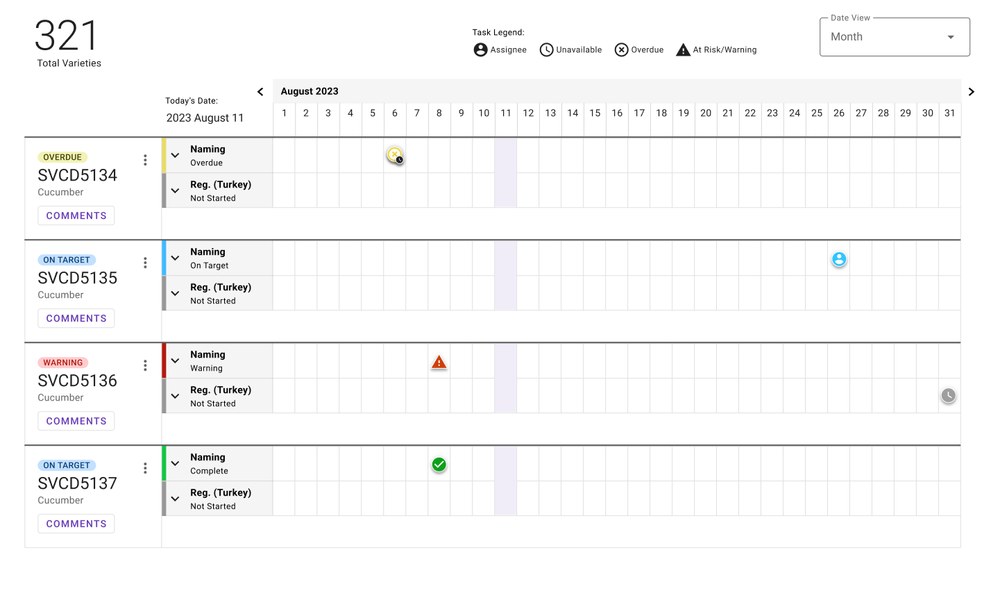 Activities - Month View
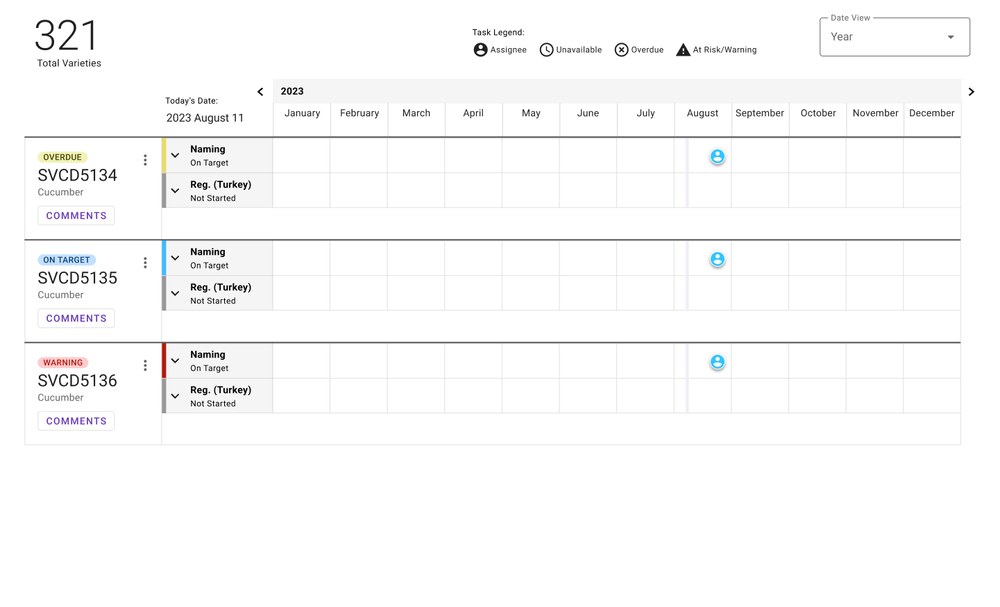 Activities - Annual View
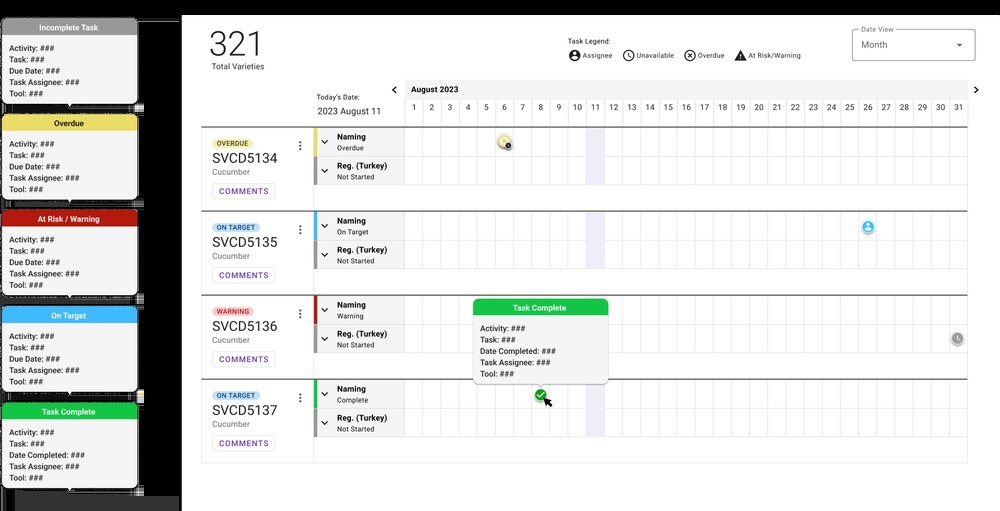 Tooltips
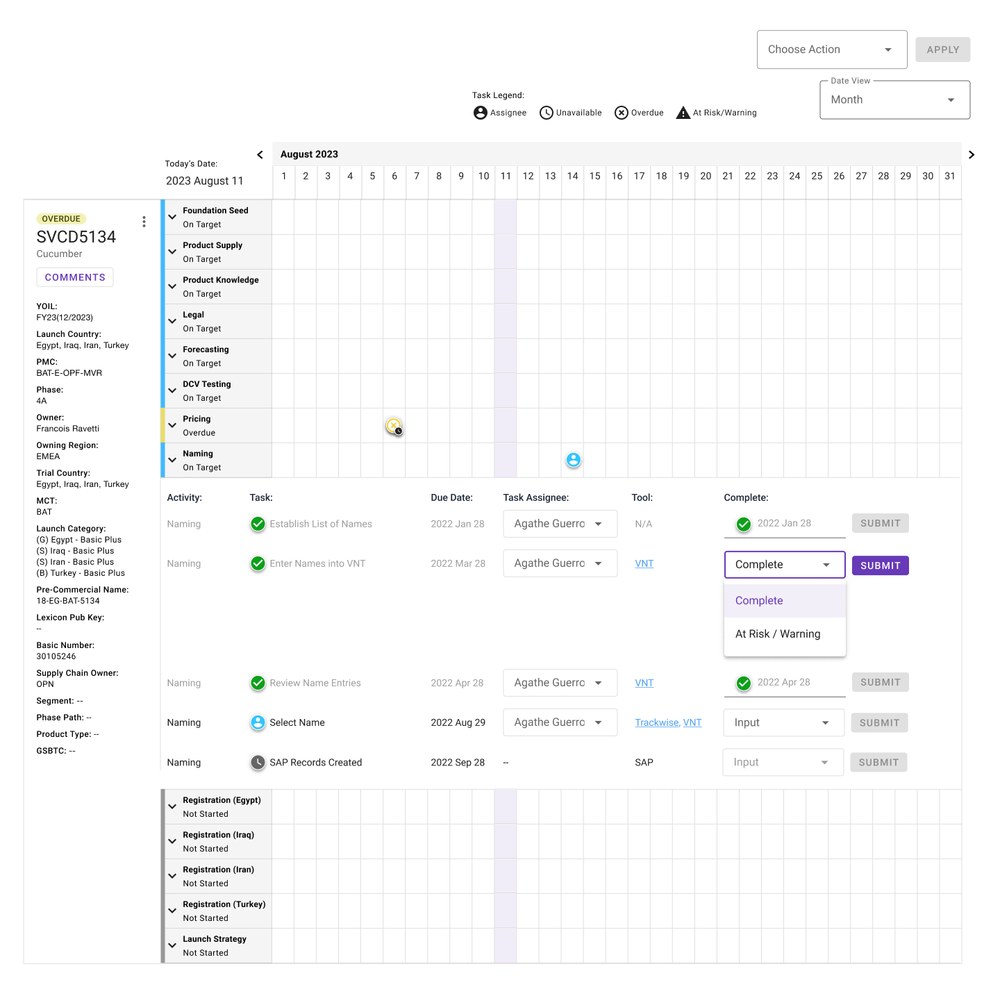 Detailed View
Feedback
Business Response
"I think we might have been able to deliver an acceptable solution for LEx, but the solution provided to LEx having the benefit of working with the Design Team is an exponentially better solution."
Validation Session Responses
"The best part of the design was the visual tracking and flow that are concentrated to the same picture [dashboard]."
"It is very visual, one can clearly see where they are and who needs to do what. It is convenient and makes life easier."
"[The dashboard] is efficiency driven."
Outcomes
The overall outcomes of the project include the design and creation of artifacts and documents such as executive summaries, interviews, user acceptance testing (UAT), feasibility studies, and other materials that accurately describe the problem, proposed solutions, and iterative processes. These artifacts are preserved for future use and reflection. The ultimate solution provided to the business goes beyond the capabilities of the project management and development teams alone, resulting in an exponentially better outcome. Instead of implementing temporary fixes, the project aims to deliver a holistic solution that truly addresses the challenges faced by the business, eliminating the need for additional workarounds. The solution is thoroughly vetted, tested, and proven to ensure its effectiveness. By deeply understanding the business needs and wants, the project aims to transform them into tangible tools that users can leverage to perform their work more easily, efficiently, and effectively, and ultimately realize the desired business value. To achieve comprehensive coverage, the project team has engaged with dozens of users in various capacities, allowing for a sense of ownership and ensuring a solution that caters to diverse user requirements.